Introduction: One can draw the graph of a Function of one variable.
Definition: The graph of a function $y$ with independent variable $x$ is a figure in a coordinate system with two axes, the $x$-axis and the $y$- axis, consisting of the points with coordinates $(x,y(x))$.
Remark: It is convention to put the independent variable $x$ on the horizontal axis and the dependent variable $y$ on the vertical axis.
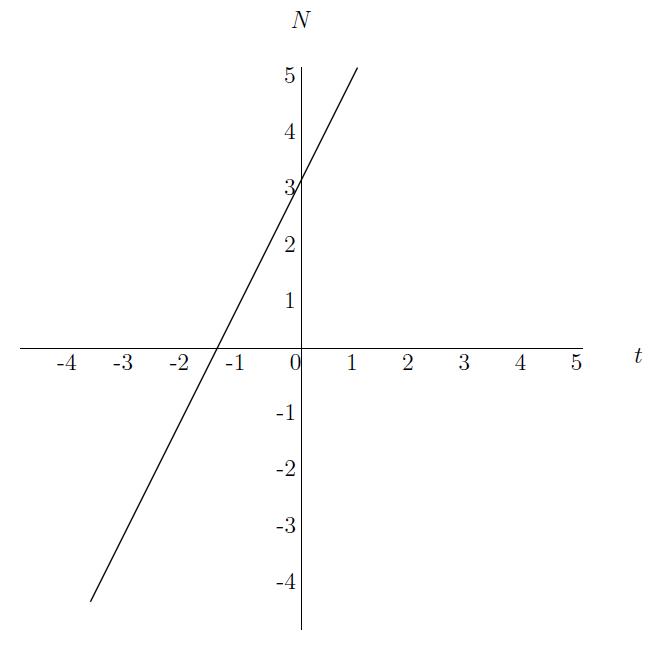
Example: The graph of $N(t)=2t+3$ looks as follows.
Definition: The graph of a function $y$ with independent variable $x$ is a figure in a coordinate system with two axes, the $x$-axis and the $y$- axis, consisting of the points with coordinates $(x,y(x))$.
Remark: It is convention to put the independent variable $x$ on the horizontal axis and the dependent variable $y$ on the vertical axis.
Example: The graph of $N(t)=2t+3$ looks as follows.