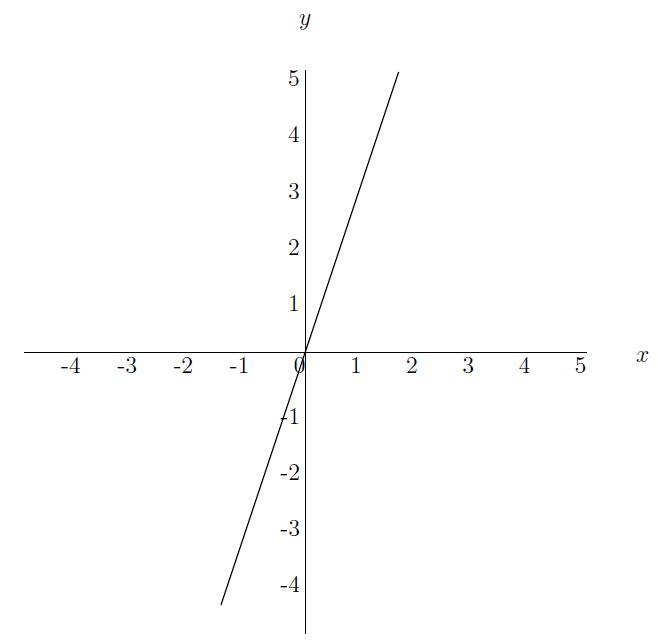
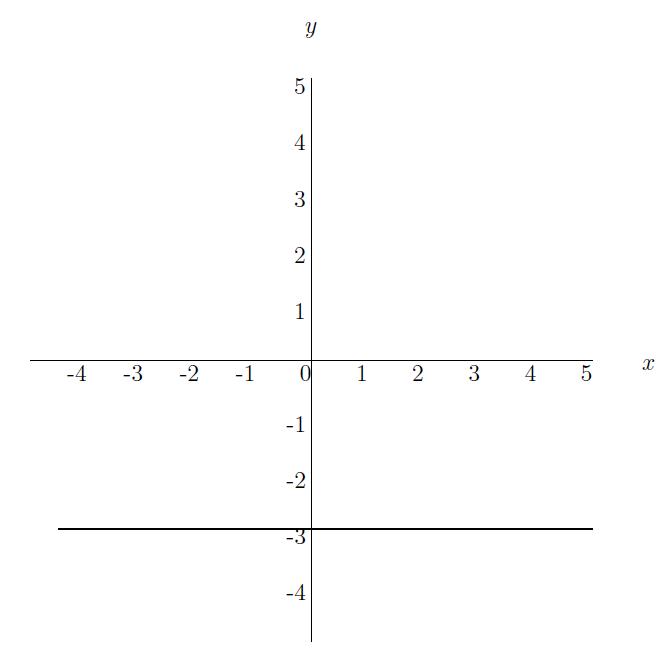
Which graph corresponds to the fuction $y(x)=-3$?
Antwoord 1 correct
Correct
Antwoord 2 optie

Antwoord 2 correct
Fout
Antwoord 3 optie

Antwoord 3 correct
Fout
Antwoord 4 optie
Antwoord 4 correct
Fout
Antwoord 1 optie
Antwoord 1 feedback
Correct: Go on.
Antwoord 2 feedback
Wrong: Pay attention to the minus-sign.
Try again.
Try again.
Antwoord 3 feedback
Wrong: $y(x)=-3$ is a constant function, not a linear function.
See Constant functions and Linear functions.
See Constant functions and Linear functions.
Antwoord 4 feedback
Wrong: $y(x)=-3$ is a constant function, not a linear function.
See Constant functions and Linear functions.
See Constant functions and Linear functions.