Which of the following graphs depicts the level curves of $z(x,y)=x^2 + y$ with values $k=4$ and $k=10$?
Antwoord 1 correct
Correct
Antwoord 2 optie
Antwoord 2 correct
Fout
Antwoord 3 optie
Antwoord 3 correct
Fout
Antwoord 4 optie

Antwoord 4 correct
Fout
Antwoord 1 optie
Antwoord 1 feedback
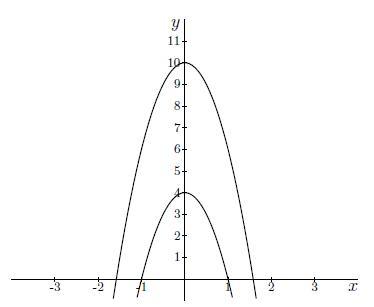
Correct: The rewriting of $x^2 + y = k$ for $k=4$ gives:
$$ x^2 + y = 4 \iff y = 4-x^2.$$
This is a downward opened parabola that intersects the $y$-axis at $(0,4)$ and the $x$-axis at $(-2,0)$ and $(2,0)$. Consequently, it is the lower curve of the two. The rewriting of $x^2 + y = k$ for $k=10$ gives:
$$ x^2 + y = 10 \iff y = 10-x^2.$$
This is a downward opened parabola that intersects the $y$-axis at $(0,10)$and the $x$-axis at $(-\sqrt{10},0)$ and $(\sqrt{10},0)$. Consequently, it is the uppercurve of the two.
Go on.
Antwoord 4 feedback