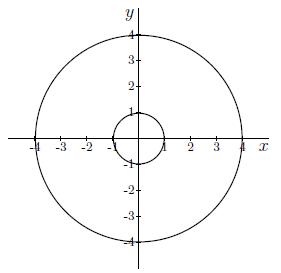
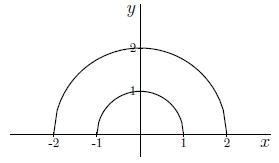
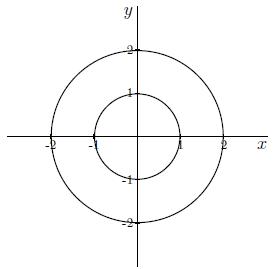
Which of the following graphs depicts the level curves of $z(x,y)=x^2 + y^2$ with values $k=1$ and $k=4$?
Antwoord 1 correct
Correct
Antwoord 2 optie
Antwoord 2 correct
Fout
Antwoord 3 optie
Antwoord 3 correct
Fout
Antwoord 4 optie
It is not possible to draw the level curves of this function, because $z(x,y)=k$ cannot be rewritten.
Antwoord 4 correct
Fout
Antwoord 1 optie
Antwoord 1 feedback
Correct: Rewriting of $x^2 + y^2 = k$ for $k=1$ gives:
$$ x^2 + y^2 = 1 \iff y^2 = 1-x^2 \iff y = \pm\sqrt{1-x^2}.$$
The graph of this is the central circle; you might recognize $x^2+y^2=1$ as the circle equation with center $(0,0)$ and radius $\sqrt{1}=1$. Rewriting of $x^2 + y^2 = k$ for $k=4$ gives:
$$ x^2 + y^2 = 4 \iff y^2 = 4-x^2 \iff y = \pm\sqrt{4-x^2}.$$
The graph of this is the outside circle; you might recognize $x^2+y^2=4$ as the circle equation with center $(0,0)$ and radius $\sqrt{4}=2$.
Go on.
Antwoord 2 feedback
Antwoord 3 feedback