We consider the function $z(x,y) = 3+x+y$. The graph of this function can be found here: Linear functions of two variables. Here we draw the level curves of $z(x,y)$ with values $k=5$ and $k=8$.
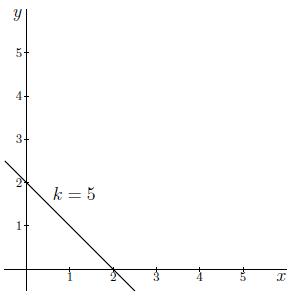
We start with the level curve of $k=5$. We draw a line that connects all the points $(x,y)$ such that
$$\begin{align}
3 + x + y &= 5\\
x + y &= 2\\\
y &= 2- x.
\end{align}$$
We obtain a linear function that intersects the $y$-axis at $(0,2)$ and has a slope of $-1$. When we draw this line, we obtain the following graph.
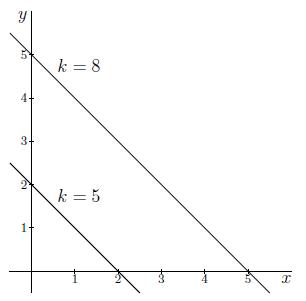
The second level curve, with value $k=8$, is drawn in the same way. We start by finding the line to which all the points $(x,y)$ that result in a function value 8 belong:
$$\begin{align}
3 + x + y &= 8\\
x + y &= 5\\\
y &= 5- x.
\end{align}$$
We obtain a linear function that intersects the $y$-axis at $(0,5)$ and has a slope of $-1$. When we draw this line, we obtain the following graph.