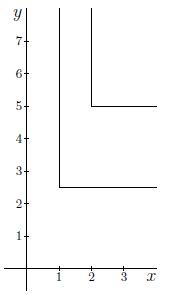
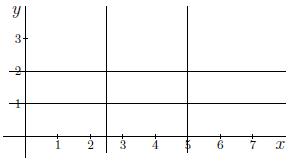
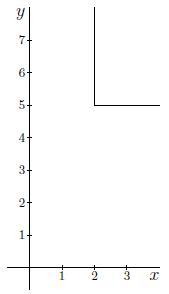
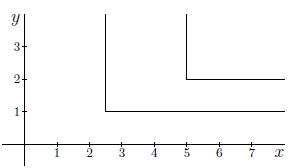
Which of the following graphs depicts the level curves of $z(x,y)=\min\{2x,5y\}$ with values $k=5$ and $k=10$?
Antwoord 1 correct
Correct
Antwoord 2 optie
Antwoord 2 correct
Fout
Antwoord 3 optie
Antwoord 3 correct
Fout
Antwoord 4 optie
Antwoord 4 correct
Fout
Antwoord 1 optie
Antwoord 1 feedback
Correct: The rewriting of $\min\{2x,5y\} = k$ for $k=5$ gives:
$$ \left\{\begin{array}{ll}
2x = 5 &\text{if~}5y\geq5\\
5y= 5 &\text{if~}2x\geq5
\end{array}\right.
\iff
\left\{\begin{array}{ll}
x = 2\tfrac{1}{2} &\text{if~}y\geq1\\
y= 1 &\text{if~}x\geq2\tfrac{1}{2}
\end{array}\right.$$
The corresponding graph is the left curve. The rewriting of $\min\{2x,5y\} = k$ for $k=10$ gives:
$$ \left\{\begin{array}{ll}
2x = 10 &\text{if~}5y\geq10\\
5y= 10 &\text{if~}2x\geq10
\end{array}\right.
\iff
\left\{\begin{array}{ll}
x = 5 &\text{if~}y\geq2\\
y= 2 &\text{if~}x\geq5
\end{array}\right.$$
The corresponding graph is the right curve.
Go on.
$$ \left\{\begin{array}{ll}
2x = 5 &\text{if~}5y\geq5\\
5y= 5 &\text{if~}2x\geq5
\end{array}\right.
\iff
\left\{\begin{array}{ll}
x = 2\tfrac{1}{2} &\text{if~}y\geq1\\
y= 1 &\text{if~}x\geq2\tfrac{1}{2}
\end{array}\right.$$
The corresponding graph is the left curve. The rewriting of $\min\{2x,5y\} = k$ for $k=10$ gives:
$$ \left\{\begin{array}{ll}
2x = 10 &\text{if~}5y\geq10\\
5y= 10 &\text{if~}2x\geq10
\end{array}\right.
\iff
\left\{\begin{array}{ll}
x = 5 &\text{if~}y\geq2\\
y= 2 &\text{if~}x\geq5
\end{array}\right.$$
The corresponding graph is the right curve.
Go on.
Antwoord 2 feedback
Antwoord 3 feedback