We consider the function z(x,y)=min{3x,4y}. The graph of this function can be found here: Minimum functions. In this example we draw the level curve of z(x,y) with value k=6.
The level curve is given by
z(x,y)=min{3x,4y}=6.
Using the alternative notation (see Minimum functions), then we can write this equation as
{3x=6if~4y≥6,4y=6if~3x≥6.
We can simplify it to
{x=2if~y≥32,y=32if~x≥2.
We draw the two lines, x=2 and y=32, in a (x,y)-coordinate system. These are the dashed lines in the left figure.
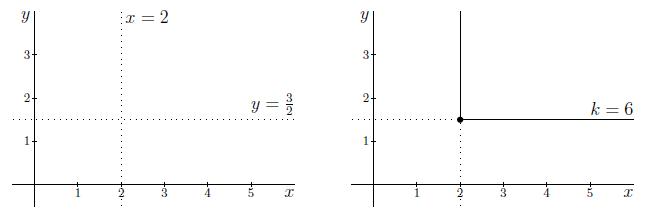
Then we use the 'if'-restrictions.
If y≥32, then the level curve is given by x=2. This is the vertical part of the line in the right figure.
If x≥2, then the level curve is given by y=32; this is the horizontal part of the line in the right figure. These lines together form the level curve of z(x,y) with value k=6.