Which of the following graphs depicts the level curves of z(x,y)=min{2x,5y} with values k=5 and k=10?
Antwoord 1 correct
Correct
Antwoord 2 optie

Antwoord 2 correct
Fout
Antwoord 3 optie

Antwoord 3 correct
Fout
Antwoord 4 optie

Antwoord 4 correct
Fout
Antwoord 1 optie

Antwoord 1 feedback
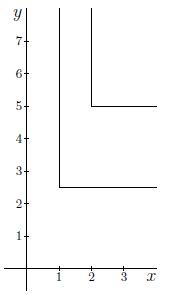
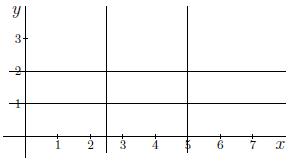
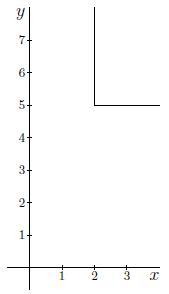
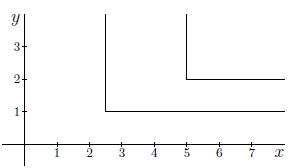
Correct: The rewriting of min{2x,5y}=k for k=5 gives:
{2x=5if~5y≥55y=5if~2x≥5⟺{x=212if~y≥1y=1if~x≥212
The corresponding graph is the left curve. The rewriting of min{2x,5y}=k for k=10 gives:
{2x=10if~5y≥105y=10if~2x≥10⟺{x=5if~y≥2y=2if~x≥5
The corresponding graph is the right curve.
Go on.
{2x=5if~5y≥55y=5if~2x≥5⟺{x=212if~y≥1y=1if~x≥212
The corresponding graph is the left curve. The rewriting of min{2x,5y}=k for k=10 gives:
{2x=10if~5y≥105y=10if~2x≥10⟺{x=5if~y≥2y=2if~x≥5
The corresponding graph is the right curve.
Go on.
Antwoord 2 feedback
Antwoord 3 feedback

